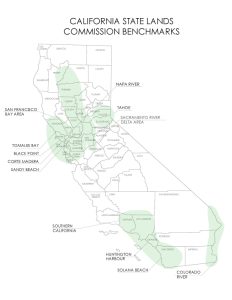
Commission lease terms may run from several months to 49 years. Rent is generally based on a percent of the land value or an established benchmark appraisal. Below are the benchmarks we use to establish uniform rental rates:
- Category 1 benchmarks are applied to private docks, piers, and buoys.
- Category 2 benchmarks are applied to cantilevered decks, sundecks, or other non-water-dependent encroachments.
Note: Benchmarks are generally updated every five years.
Category 1 Benchmarks
* per buoy
| Location | Rental Rate ($/SF) | Last Updated | Proposed Update |
|---|---|---|---|
| Tomales Bay berths | $0.133 | December 2020 | 2025 |
| Tomales Bay buoys * | $140 | December 2020 | 2025 |
| Lake Tahoe berths | $0.814 | December 2021 | 2026 |
| Lake Tahoe buoys * | $273 | December 2021 | 2026 |
| San Francisco Bay Area | $0.227 | February 2022 | 2027 |
| Southern California | $0.451 | June 2022 | 2027 |
| Colorado River | $0.217 | February 2023 | 2028 |
| San Pablo Bay | $0.206 | February 2025 | 2030 |
| Sacramento River | $0.246 | August 2025 | 2030 |
| Delta Area | $0.197 | August 2025 | 2030 |
Category 2** Benchmarks
** The Category 2 Benchmark may be discounted to reflect that the sovereign land being leased may not have the same utility as the upland property.
| Location | Rental Rate ($/SF) | Last Updated | Proposed Update |
|---|---|---|---|
| Black Point | $0.47 Proposed = $1.24 | June 2020 | December 2025 |
| Lake Tahoe | $13.05 | December 2021 | 2026 |
| Huntington Harbour | $41.22 | June 2022 | 2027 |
| Solana Beach | $91.53 | April 2024 | 2029 |
| Corte Madera | $5.22 | June 2024 | 2029 |
| Sandy Beach | $5.13 | August 2024 | 2029 |
| Napa | $7.02 | April 2025 | 2030 |

